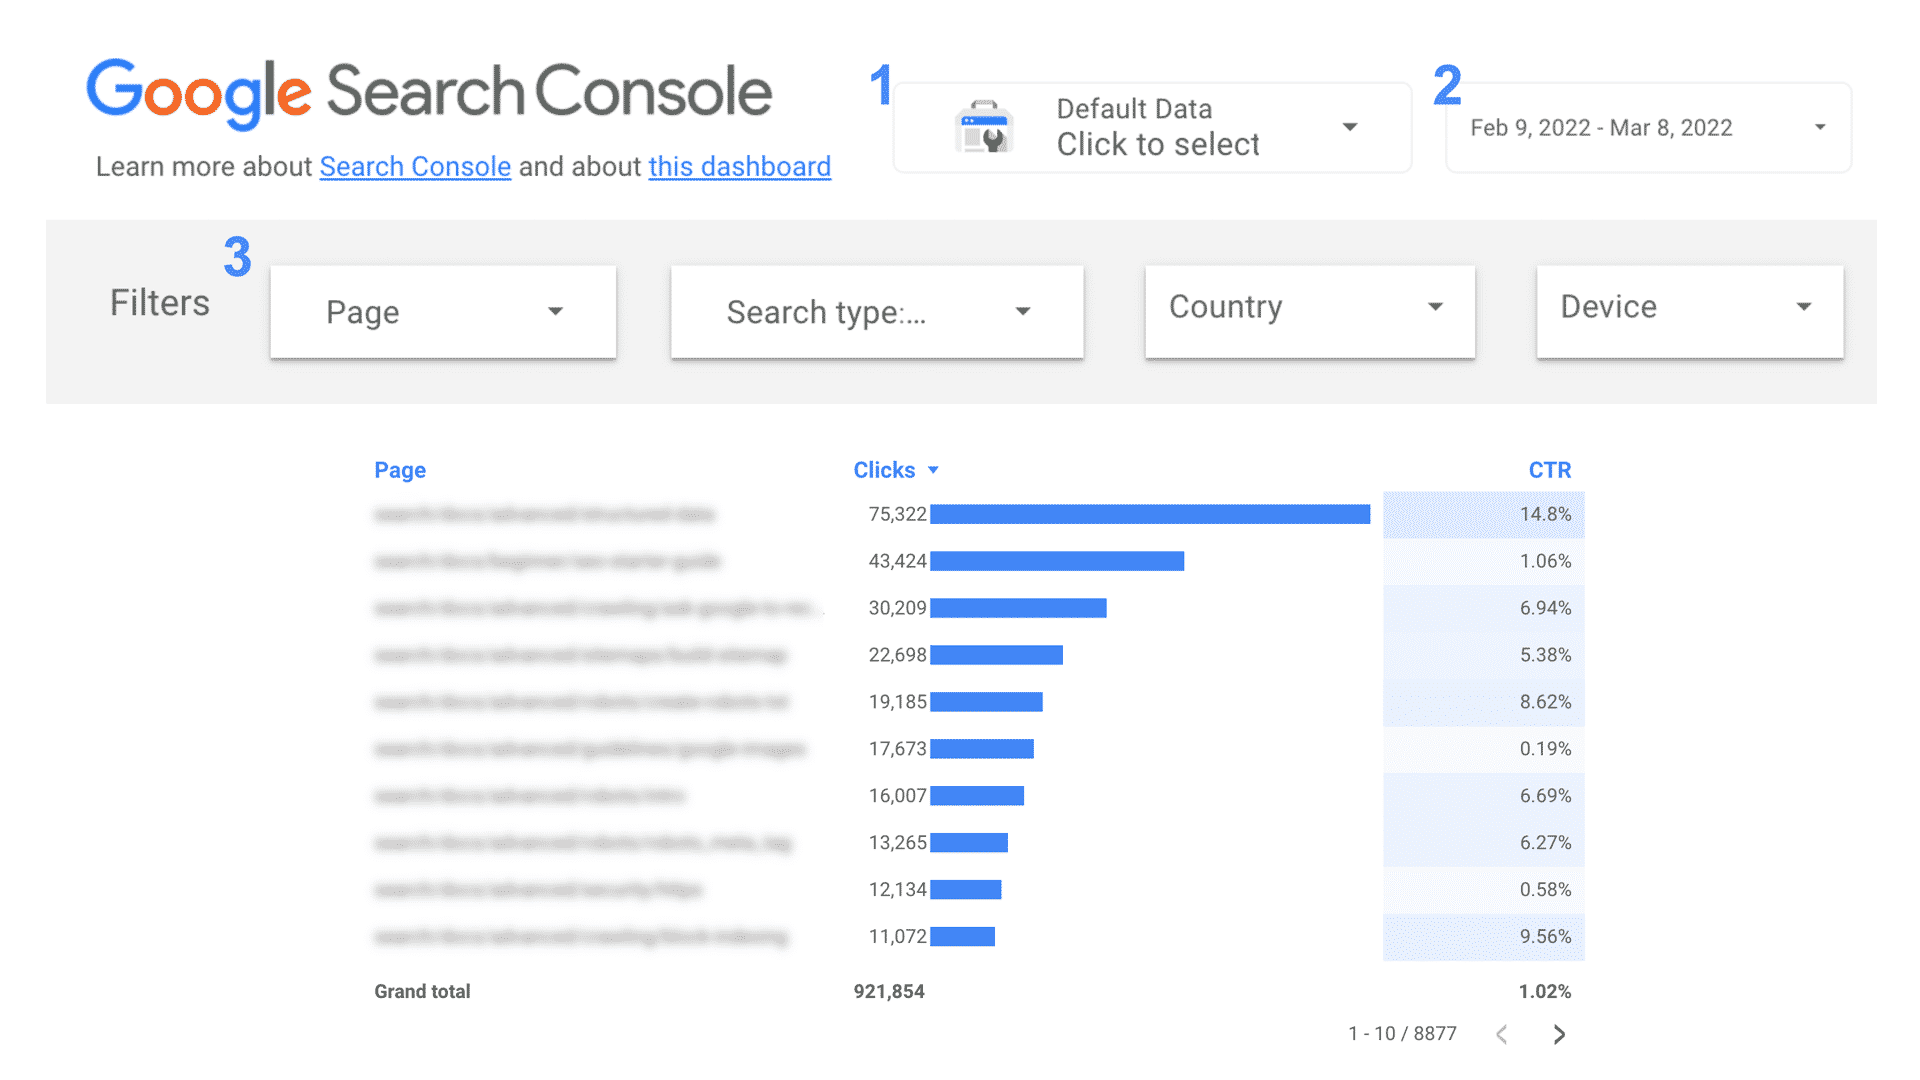
Google has created a new Data Studio template. You can use Google’s Search traffic monitoring dashboard to quickly see if there are any significant changes to the performance of your most important pages and help uncover whether you may have any potential SEO issues.
Google also announced that its Search Console connector now includes Discover and Google News traffic data. Google added similar data to the Search Console Search Analytics API in October.
How to get the dashboard. You can access the dashboard here.
Once you’ve set up the Search traffic monitoring dashboard, you can choose the date range (it’s the last 28 days by default). Then you filter your data by pages, types, countries and devices.
How to set up the dashboard. It’s pretty straightforward. Navigate to Data Studio and create a Search Console data source.
Choose the URL Impression table, which includes URL-level data for web, image, video, news, discover, and googleNews. The Property Parameter you choose will be your default in your report, but you can access the others via a filter.
Google added a couple of “bonus” tips:
- Under report and page layout, set Display mode to Fit to width. This will make your dashboard mobile-friendly for monitoring on the go.
- If you don’t have subdomains, consider removing your domain name (using a calculated field with the expression
REGEXP_EXTRACT(Landing Page, ".*\.com/(.*)$")). Google said this makes your tables less cluttered.
Why we care. This is another helpful Data Studio template from Google to visualize data as line charts, bar charts or tables. The addition of Discover and News traffic to the connector is also a welcome bonus. It’s critical to watch the metrics on your most important pages. This template should help make that task a bit easier.

